
Did you know there is a ‘meal gap’ and that over 268,850 of our Greater Triangle neighbors fall into it? For the sixth year Feeding America has produced their Map the Meal Gap Study, a detailed analysis of food insecurity in every county and congressional district in the nation. Feeding America utilizes the most recent data available (from 2014) to create an interactive map displaying: food insecurity rate, estimated SNAP program eligibility rate, average meal cost, and additional money required to meet food needs (the Meal Gap) … county by county. If you’re into maps, infographics, statistics, or hunger in your community, it’s certainly worth the click.
Food-insecure individuals report in Map the Meal Gap that they would need an additional $16.82 per person per week to adequately feed their households. It doesn’t sound like all that much, does it? Partnering with the Food Shuttle with your gift today helps “fill the gap” for more of our hungry neighbors. How many weeks can you fill? One week?...5 weeks?...10 weeks?

“This report provides a valuable understanding of where we stand as a state, a region, and as a nation. If we don’t have hard facts and numbers telling us where we started, we will never know how effective we are being,” says Dave Koch, IFFS Executive Director
The good news is that in our seven-county service area, food insecurity is down slightly over the previous year (15.2% vs the previous 15.7%). However, the bad news is that within that 15+ percent of food-insecure households, a full 34% earn too much money to qualify for SNAP benefits. This is how vital the Food Shuttle, our partner agencies, and our coordinated hunger-relief efforts are. We feed, teach, and grow to fill in the gap.
“The numbers are improving, but there is still a long way to go before our work is done and the Triangle is hunger-free,” says Jill Staton Bullard, IFFS Co-Founder and Emeritus CEO.
Food insecurity, defined by the USDA as “limited or uncertain access to enough food to support a healthy life,” is present in every county and congressional district in the country. Nearly 90% of the worst-hit counties are located in the South, where nearly 3.5 million individuals are estimated to be food insecure. In almost every county, children are at higher risk of food insecurity, as are African-Americans.
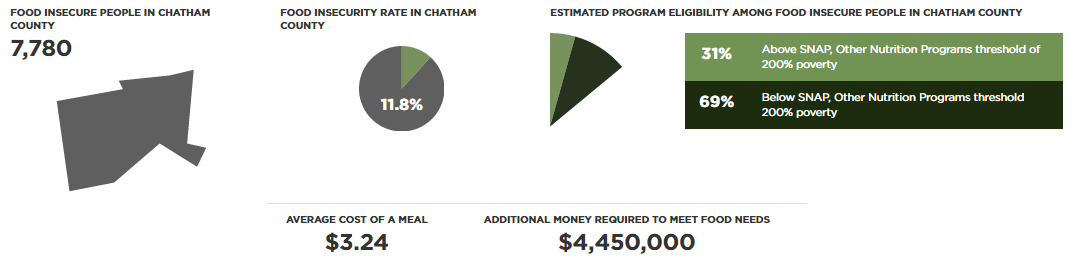
Here’s a county-by-county look at the state of hunger in the IFFS service area:
CHATHAM COUNTY:
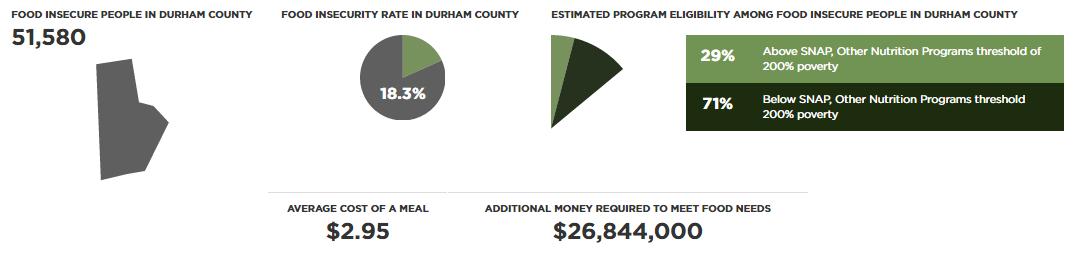
 DURHAM COUNTY:
EDGECOMBE COUNTY:

JOHNSTON COUNTY:

NASH COUNTY:

ORANGE COUNTY:

WAKE COUNTY:

Feeding America has published the Map the Meal Gap project since 2011, thanks to the generous support of The Howard G. Buffet Foundation, Nielsen, and theConAgra Foods Foundation, to learn more about the face of hunger at the local level. Read more about the findings of Map the Meal Gap in our Executive Summary, access local food insecurity data tables by state or learn how we got this data.
———-
By Sally Bache, IFFS Administrative Services Manager. Contact: Sally@FoodShuttle.org